
The Argument Was Never About the Model. It Was About the Sample Size.
Three timepoints, nine runs, and what happens to a launch-day argument once you put error bars on both sides of it.

Launch-day threads for a new frontier model reliably split into two camps within the same afternoon. One says the model regressed, here’s the task that proved it. The other says that’s overreacting, here’s the task that proved the opposite. Neither side is lying. Both are reporting a real, single data point as if it were a trend, and a coin flip looks exactly like a trend if you only flip it once.
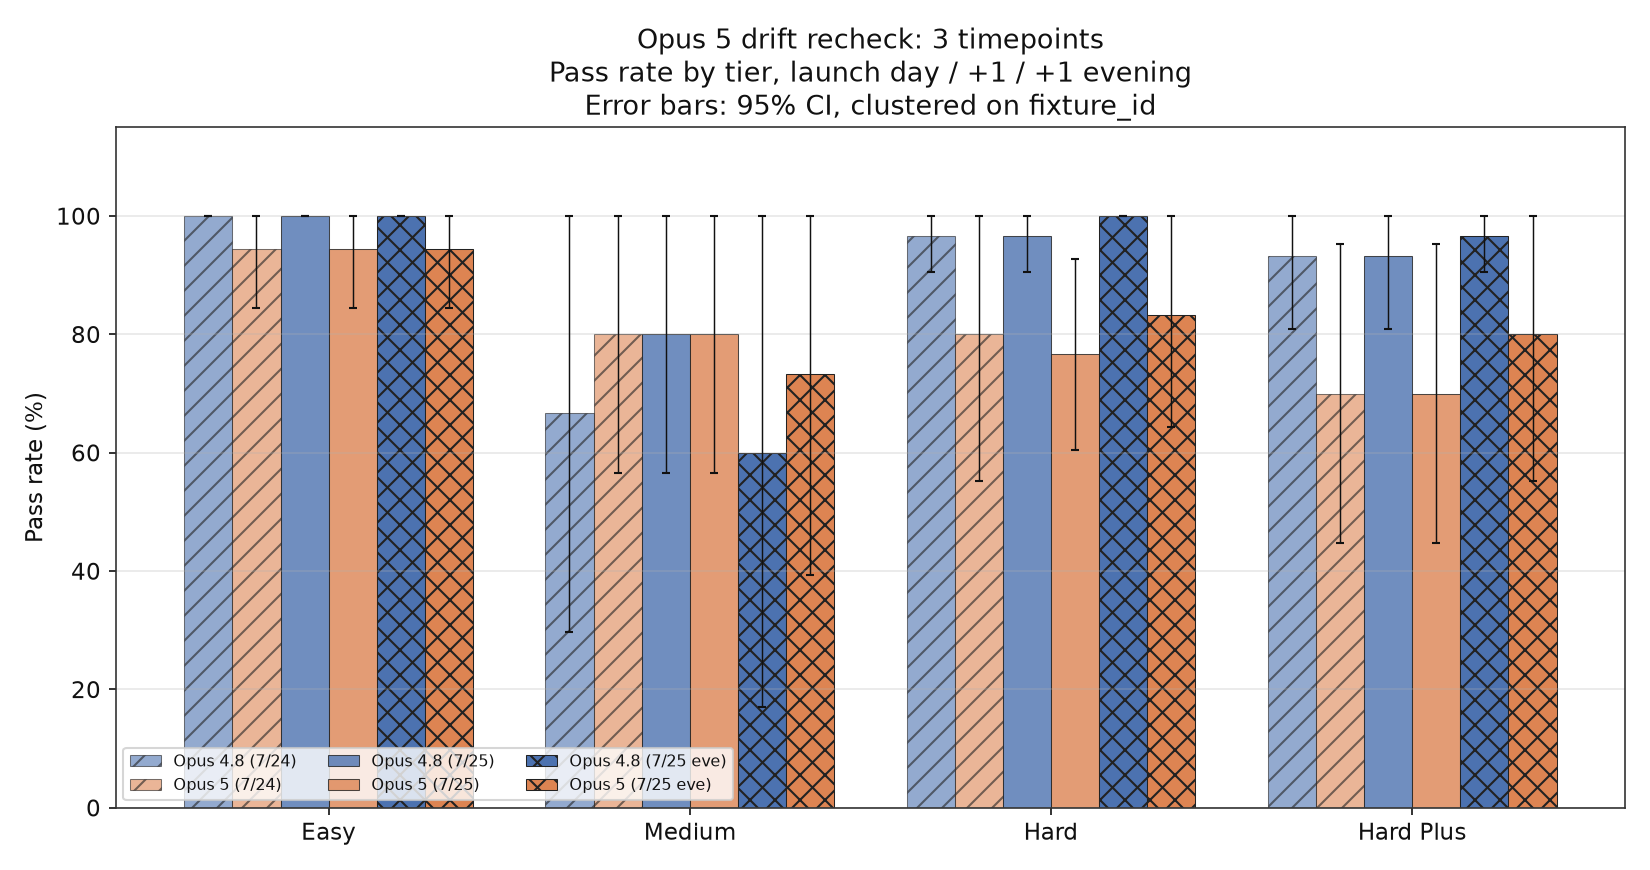
I run a benchmark panel against my own production codebase every time a frontier model ships: 31 coding fixtures across four difficulty tiers, the same tasks and grading for every model in the panel. When Opus 5 shipped, I ran it that afternoon against Opus 4.8, the model it was replacing in my default rotation, plus Sonnet, Haiku, a local Devstral model, and Fable. Three runs, same session. Then I ran the identical panel again the next day, and again that same evening, specifically because a single afternoon’s worth of runs was never going to settle an argument like this one on its own. Three independent timepoints, nine runs total, 279 paired observations on the comparison that matters most.
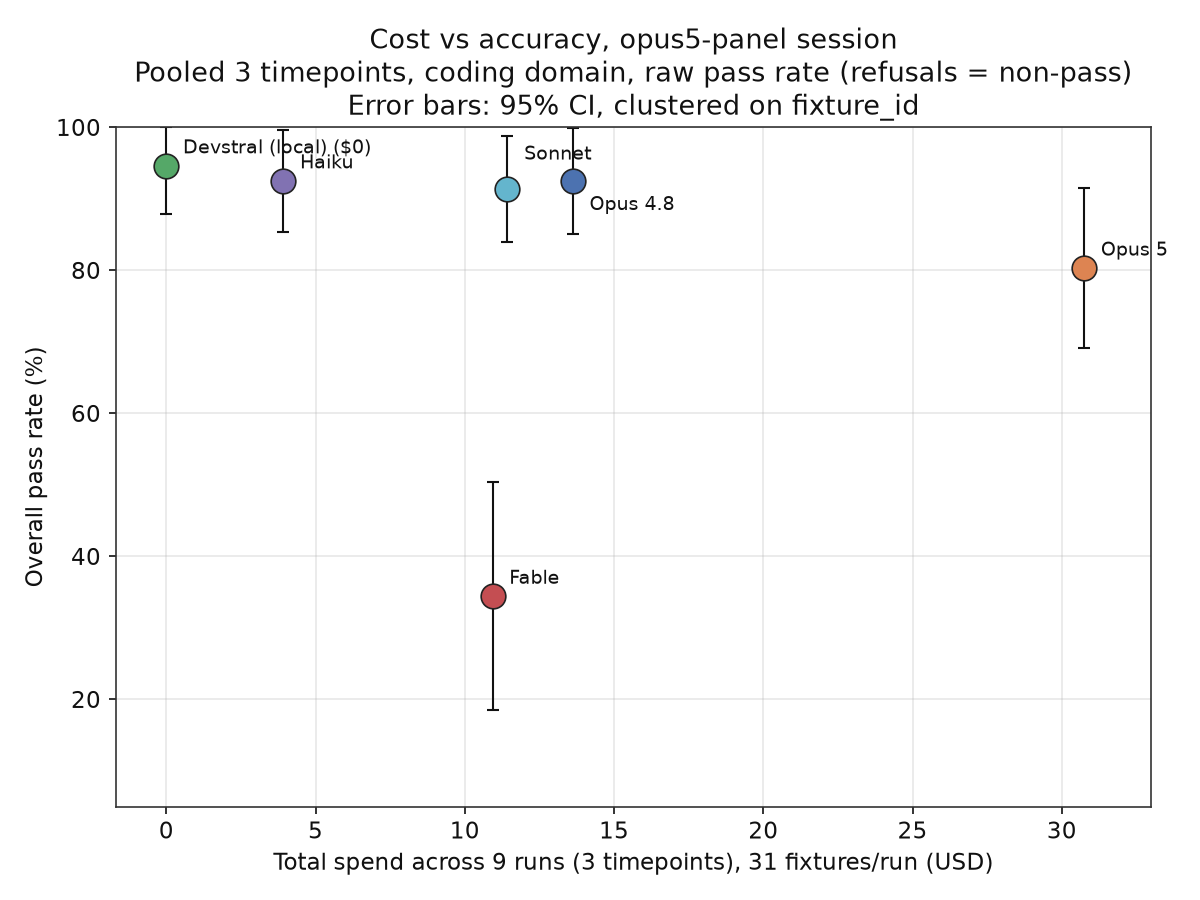
The point estimate held up across all three checks. Opus 5 came in around 80% overall pass rate; Opus 4.8 came in around 92%, roughly a 12-point gap, pooled. Opus 5 also cost about 2.3 times as much to run the same panel, consistently, at every single timepoint: 2.28x, 2.21x, 2.28x. That’s not a sampled number, it’s a sum of dollars actually spent on runs that actually happened, and it’s the most stable figure in the whole series.
It wasn’t a clean sweep either way. Broken out by tier, Opus 5 actually won the medium-difficulty tier at every single timepoint, 78% to 69% pooled. It lost easy, hard, and hard-plus, and lost the pooled overall by a wide enough margin that “behind Opus 4.8, on my coding suite, across three independent checks” is a fair read of the point estimate on its own.
Here’s where I put the error bar on it, and where both sides of the launch-day argument stop being supportable. A naive confidence interval on that pooled 12-point gap looks airtight: [+6.5pp, +17.9pp], comfortably clear of zero, exactly the kind of number that would read as “confirmed” in either direction of the argument. But a 31-fixture panel run three times isn’t 93 independent trials, it’s 31 questions with three correlated attempts each, and treating every repeat as its own independent data point overstates how sure anyone actually is. Cluster the standard error properly, grouping repeated attempts at the same fixture before computing uncertainty, and the interval widens to [-1.7pp, +26.1pp]. It touches zero.
The same pattern shows up timepoint by timepoint:
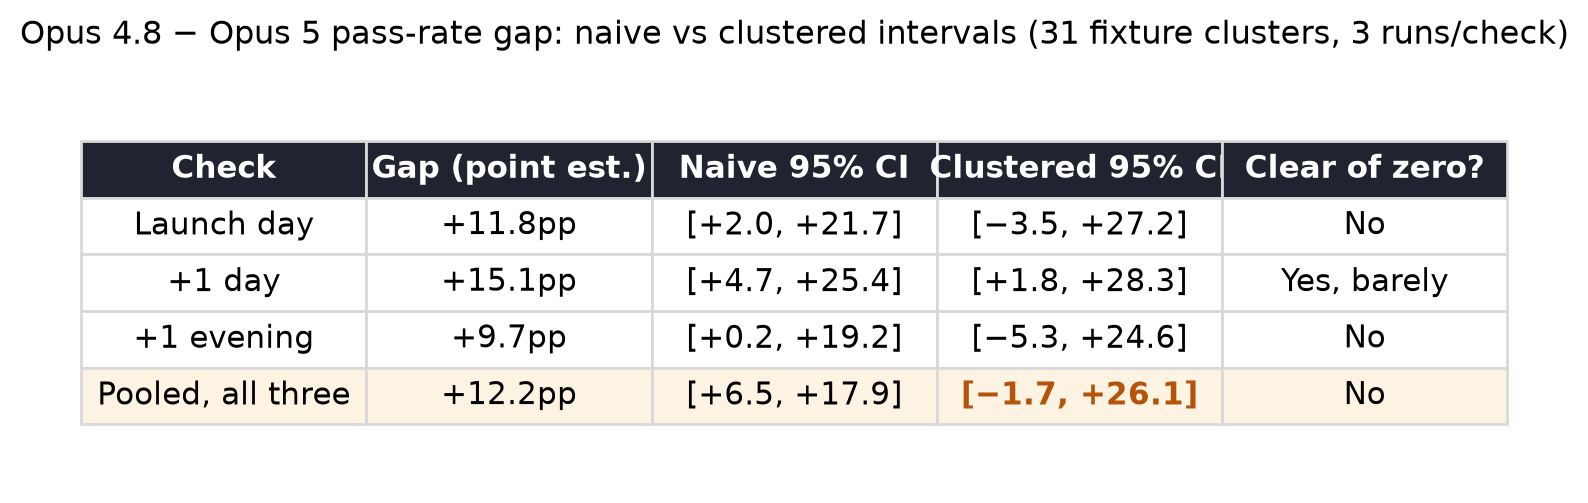
Three of four checks dissolve once clustered honestly. The minimum gap this panel could reliably detect at its actual size, 80% power, standard significance threshold, works out to about 19.8 points. The gap I measured is 12.2. It’s below the floor this battery can actually see clearly, which is exactly why the interval keeps landing on zero.
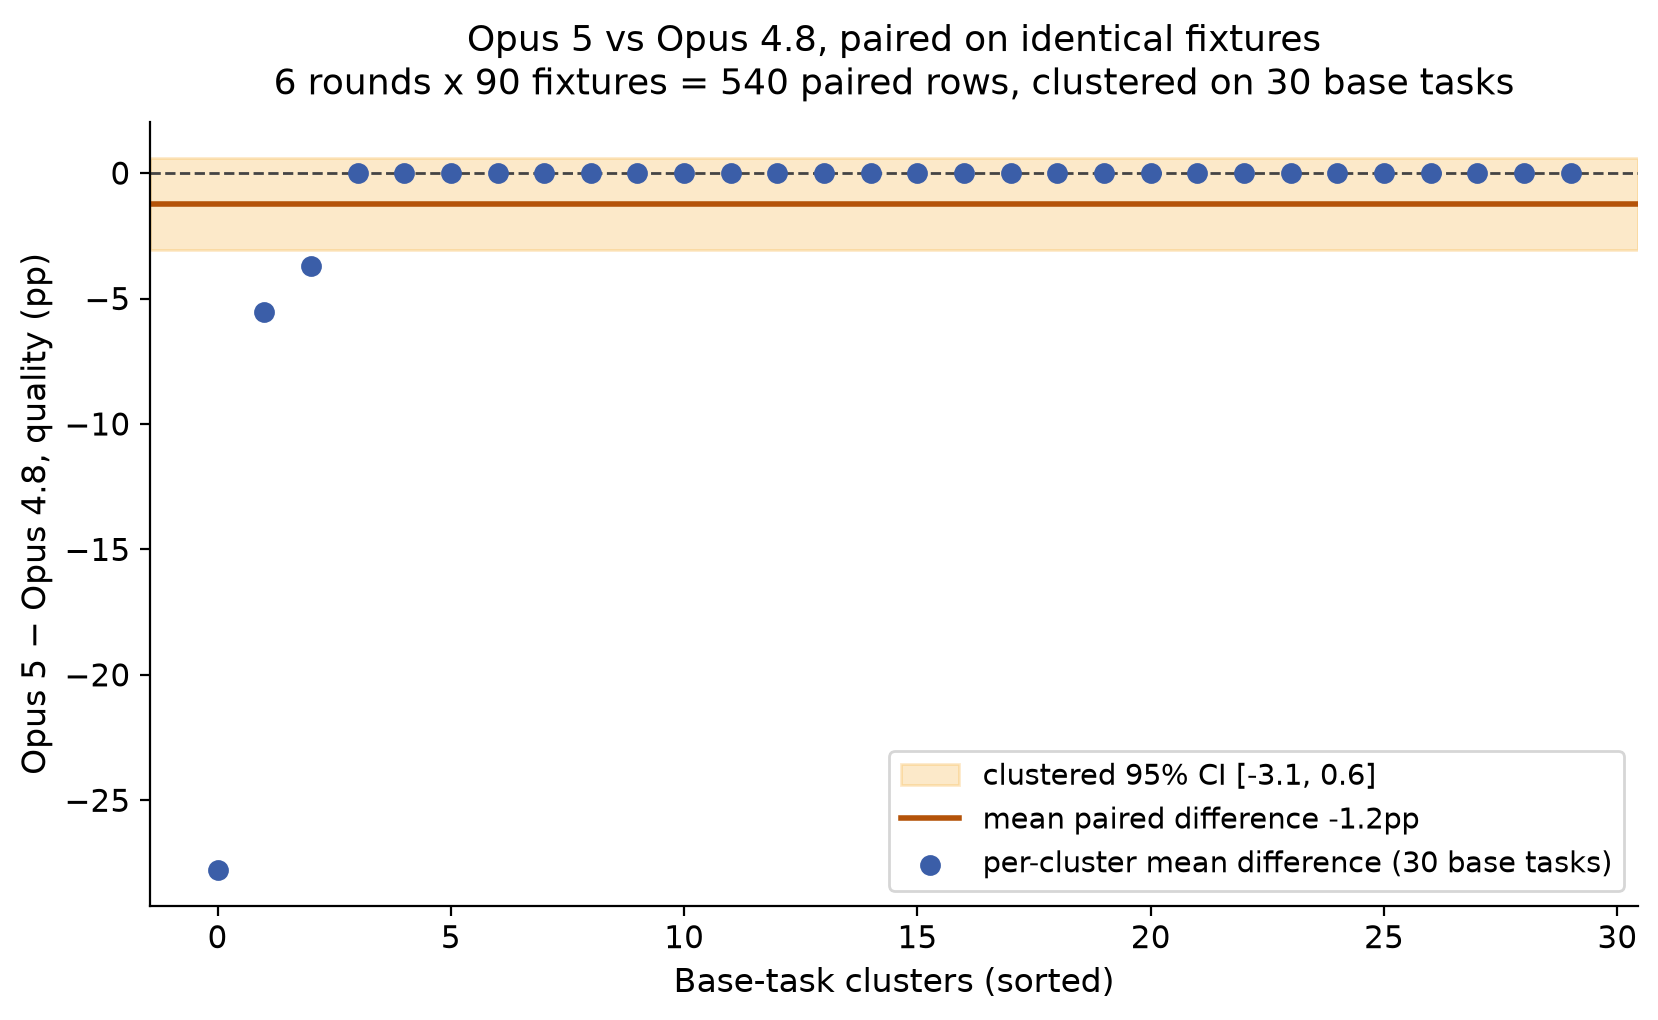
While this piece was in draft I ran a second battery that bounds the question from the other side: thirty independent production-shaped tasks, ninety fixtures, six rounds, both models on identical inputs, 540 paired observations. On that set the two are statistically indistinguishable, a paired clustered difference of -1.2 points with a 95% interval of [-3.1, +0.6], and a detectable floor of about 2.6 points, because both models sit essentially at ceiling on tasks of that everyday shape (Opus 4.8 passed all 540; nearly all of Opus 5’s small deficit is refusals concentrated on two production-framed fixtures, one of which it declined in five of six rounds). So the contested 12-point gap, whatever is real inside it, lives specifically in the harder tail of the difficulty range, on exactly the tasks where this panel’s resolution is weakest. Pinning it down takes harder fixtures, not more reruns of the ones I have.
So neither side of the launch-day argument gets to claim this. “It got worse” isn’t supported once you test it honestly, the 31-fixture panel this comes from can’t yet distinguish a real 12-point regression from an unlucky draw on which fixtures went which way. “It’s fine, people are overreacting” isn’t supported either, the point estimate favors the older model consistently, at every one of three independent checks spanning roughly a day, and I’m not pretending that number moved just because the interval is wide.
What the three checks did establish, cleanly, is stability. Compare the spread across all three timepoints (2.2 to 4.3 points, model to model) against the spread a single stable model showed within one afternoon’s three runs alone: Opus 4.8’s own medium-tier score bounced between 60% and 80% across three back-to-back runs on launch day, a model that’s been in production for months with nothing unusual going on. Every range in the three-timepoint series sits comfortably inside that single-day noise band. Opus 5 didn’t drift further. It didn’t recover either. The number that should have anchored the discourse wasn’t “better” or “worse,” it was “stable, expensive, and still inside the noise this panel can’t yet resolve,” and that’s a duller headline than either side of the argument was running with, and a more honest one.
There is still a usable conclusion in here, because the launch-day argument and the purchasing decision are two different questions carrying two different burdens of proof. Claiming “Opus 5 regressed” needs an interval that excludes zero, and this panel can’t produce one. Declining to pay for it doesn’t. Opus 5 costs 2.3x the model it replaced (the most stable number in this entire series) and across three checks it never once produced a slice of this suite where it was clearly ahead. It trailed on easy, hard, and hard-plus at every single timepoint. Its one winning tier, medium, is the noisiest tier in the whole panel — the same tier where the incumbent bounced twenty points inside a single afternoon. And on the everyday-shaped second battery, it’s a tie at ceiling, which means paying the multiplier for parity. A premium model has to earn its multiplier somewhere, and on this suite it didn’t. So my routing stays where the data can actually support it: the cheaper incumbent as the coding default, the new model re-tested as the fixture set and sample grow, and no 2.3x bill for a difference I can’t measure. If your workload is concentrated in that medium band, run the battery yourself before deciding. That’s what publishing the fixtures is for.
Everything above is scoped to coding tasks run through my own harness across three checks spanning about a day. It is not a claim about Opus 5’s capability in general, on other people’s benchmarks, or on non-coding work, and I’ll keep rechecking as the sample grows.