
Your Vendor's Benchmark Is Not Your Workload
Two points on SWE-bench is not a decision.

You’re choosing a model for your team. Two candidates sit a point or two apart on SWE-bench Verified, the vendor decks quote the scores to one decimal place, and you’re trying to turn that delta into a decision about what your engineers use every day. I want to walk through why that number cannot answer your question, and what actually can.
Start with what the score measures, stated fairly. The labs are not training on the test set. What they are doing is post-training with reinforcement learning on agentic coding environments shaped like the benchmark: a Python bug in a large open-source repo, run the tests, submit a patch. That’s a task distribution, and when you optimize a model against a distribution, the score stops measuring general coding ability and starts measuring optimization against that distribution. This is Goodhart’s law operating in the open, no cheating required. Contamination is a real secondary risk for SWE-bench specifically, since the tasks are drawn from public GitHub issues that predate 2023 and have been on the open internet ever since, but the targeting mechanism does the heavier lifting and would exist even with a perfectly sealed test set.
Now the degrees of freedom underneath that decimal point. SWE-bench Verified has 500 tasks, so one point of score is about five tasks going the other way. No leaderboard entry ships with an error bar. And the effective sample is smaller than 500, because the tasks come from a small set of popular Python repositories, and tasks from the same repo share whatever made that repo’s issues easy or hard. When I ran that correction on my own panel’s numbers, headline gaps that looked airtight touched zero; the piece publishing alongside this one walks through it. The same arithmetic applies here: the independent unit is closer to the repo than the task, and there are far fewer repos than tasks. Then there’s the scaffold. The same model run through different harness configurations shows a documented spread of about five points on this family of benchmarks. A leaderboard entry silently bundles model, scaffold, prompt, and retry policy into one number, and the scaffold term alone can be several times larger than the gap you’re squinting at.
SWE-bench tracked something real, and pretending otherwise would be its own kind of vibes post. Models went from single-digit percent to above 70% in roughly two years, and no amount of targeting explains a move that size; the capability is genuinely there. Big gaps on this benchmark are informative. A model at 30% and a model at 70% are different tools. What’s noise plus targeting is the small release-over-release delta, the one or two points that marketing pages are built on. I am not arguing the benchmark measures nothing. I am arguing it doesn’t measure your workload, and the smaller the gap, the more the measurement is about the benchmark and the less it’s about you.
Because think about what your team actually does all day. Chores. Refactors that have to respect an undocumented constraint. Tasks that arrive embedded in a live module rather than as a clean prompt. Work where a refusal or a hallucinated rewrite costs more than a wrong answer. Work where cost per task compounds across a fleet. The leaderboard has no cell for any of it.
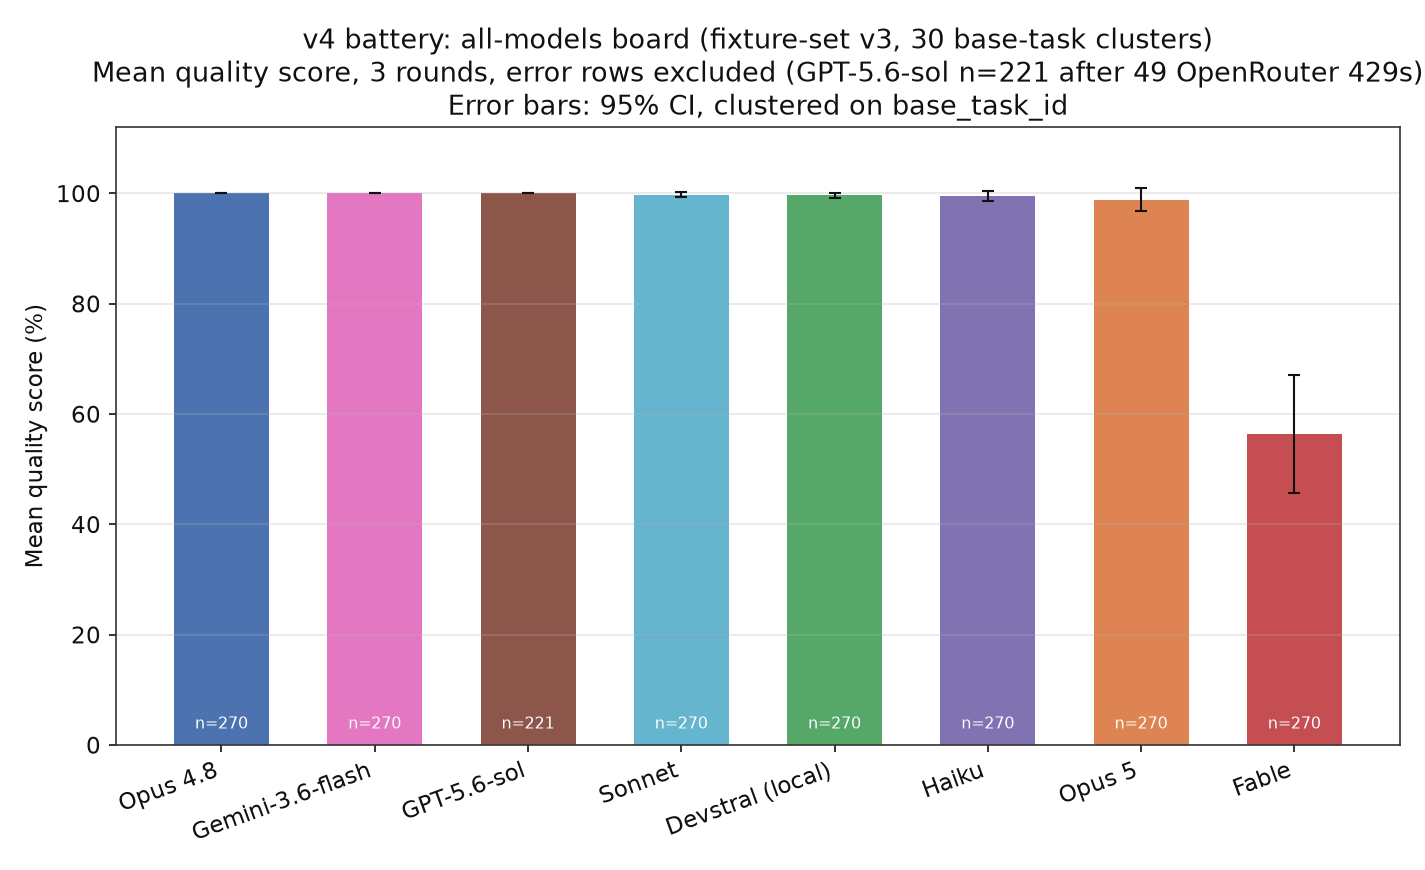
When I built cells for it, the ranking the leaderboard implies fell apart. My latest battery is 30 independent clusters of production-shaped coding tasks, each rendered in three format variants, run three times per model, 270 scored rows apiece, with every interval clustered on the underlying task. Seven of the eight models I ran sit between 98.9% and 100.0% on quality. Haiku, the cheap tier, scored 99.5% with a clustered 95% interval of [98.6, 100.5], statistically indistinguishable from Opus 4.8’s clean 100.0%, and it did that for $2.74 of spend against Opus 4.8’s $8.30 and Opus 5’s $15.97. (Yes, that interval pokes above 100. A proportion can’t beat a perfect score; that’s the normal approximation running out of resolution at the ceiling, printed as computed.) On everyday-shaped work, the efficient tier is at the same ceiling as models costing three to six times more. The eighth model, Fable, a current flagship, scored 56.4%, and every point of that gap is refusals, a failure mode that has no column on any public leaderboard. Meanwhile the thing the benchmark deltas are supposedly tracking, flagship separation, doesn’t exist on this task shape at all.
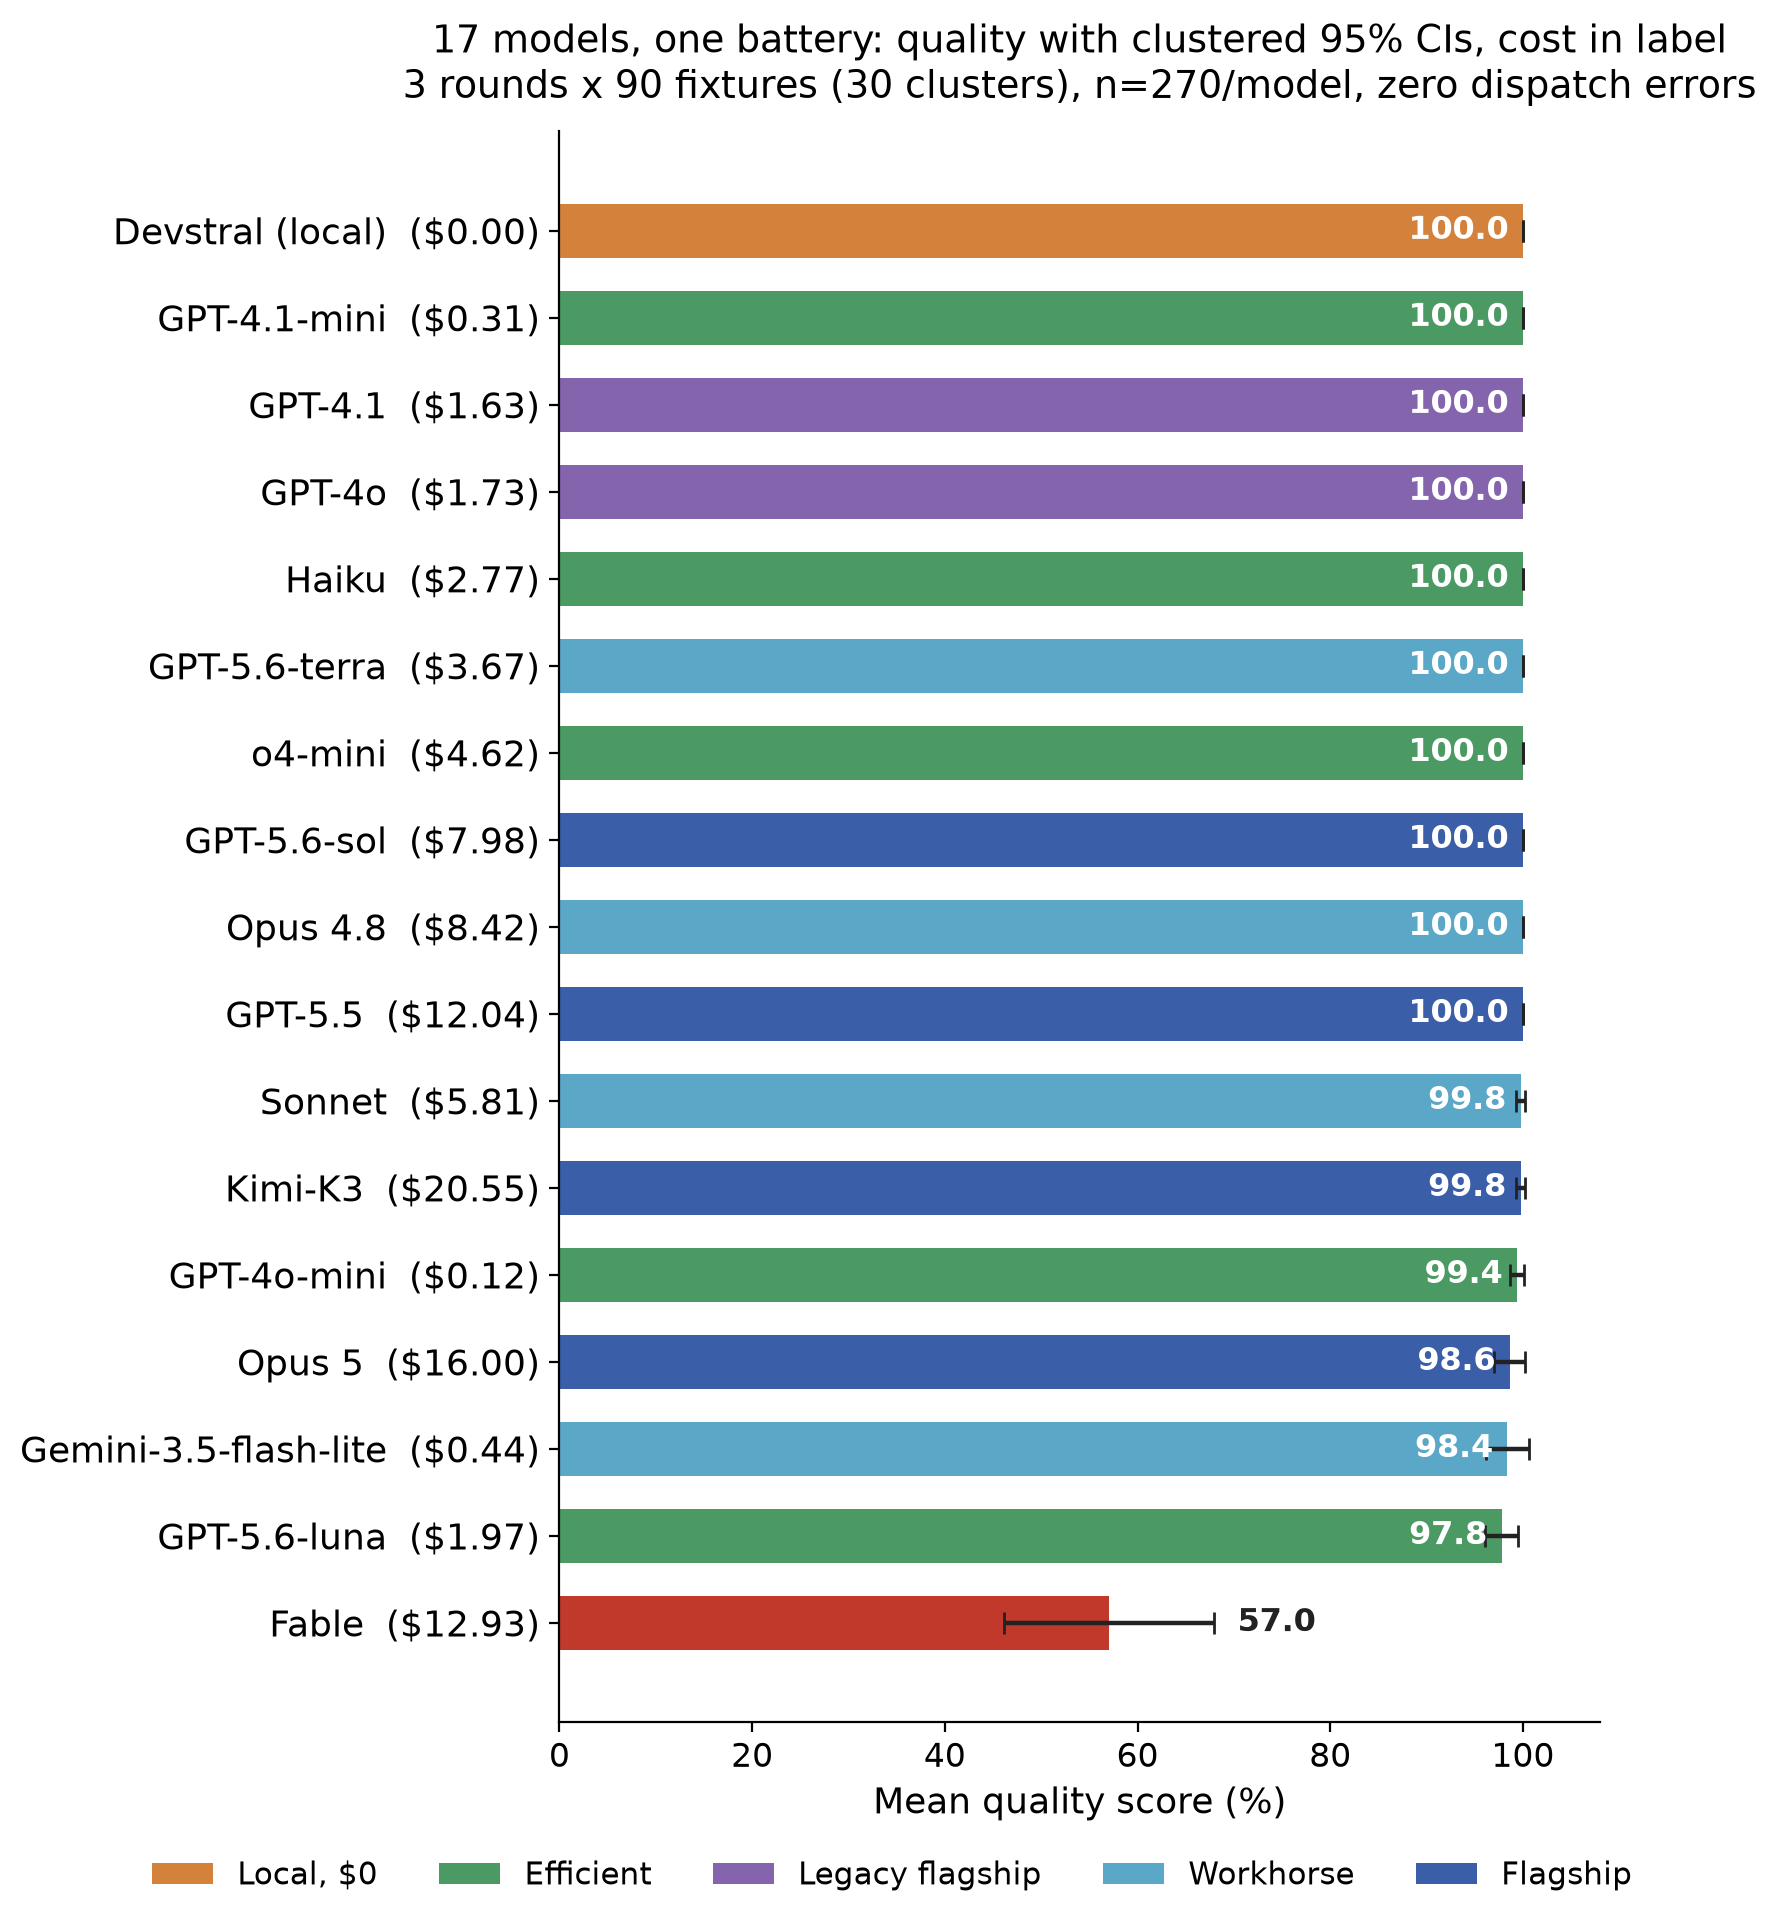
There’s a structural reason to expect this. Benchmark-targeted RL budgets concentrate where the marketing stakes are, on flagship tiers, and the optimization concentrates on benchmark-shaped tasks. So efficient-tier models end up underrated by benchmark scores relative to how they perform on ordinary work, which is precisely the work most teams would deploy them on. The supplemental board bears this out: Haiku scored a clean 100.0% across all 270 rows, exactly tied with GPT-4o, GPT-4.1, and o4-mini, yesterday’s flagship and reasoning tiers, so on this work the two-year-old leaderboard kings and today’s cheap tier are the same tool. Haiku did it for $2.77 of spend against o4-mini’s $4.62, though the legacy pair has itself been repriced into budget territory, $1.63 for GPT-4.1 and $1.73 for GPT-4o, which is its own kind of confirmation that nobody should be paying flagship rates for work of this shape. The GPT-5.6 family sorted the same way: sol and terra both at 100.0% for $7.98 and $3.67, and luna, the efficient variant, at 97.8% with a clustered interval of [96.1, 99.5], the only member of the family that separates from the ceiling at all.
All of which points at the same remedy. The only benchmark that can’t be optimized against you is the one you run yourself, on your own task mix, with tasks the labs have never seen because they live in your repo and nowhere else. That’s not a purity argument, it’s a measurement argument: your distribution is the one you care about, so sample from it. Alongside this piece I’m publishing the first drop of my fixture battery, four fixtures across four difficulty tiers, fully inline, with the grading checklist included, so you can run the same kind of panel on your own agent this afternoon. Every number that comes out of mine follows one contract, and I’d hold yours to it too: every claim carries its sample size, its interval, and the unit it was clustered on. If a number can’t tell you how wrong it might be, it isn’t a measurement yet.
Everything above is scoped to coding tasks run through my own harness, and my board numbers are my board’s, not a general ranking. But that’s the point. Yours should be yours.